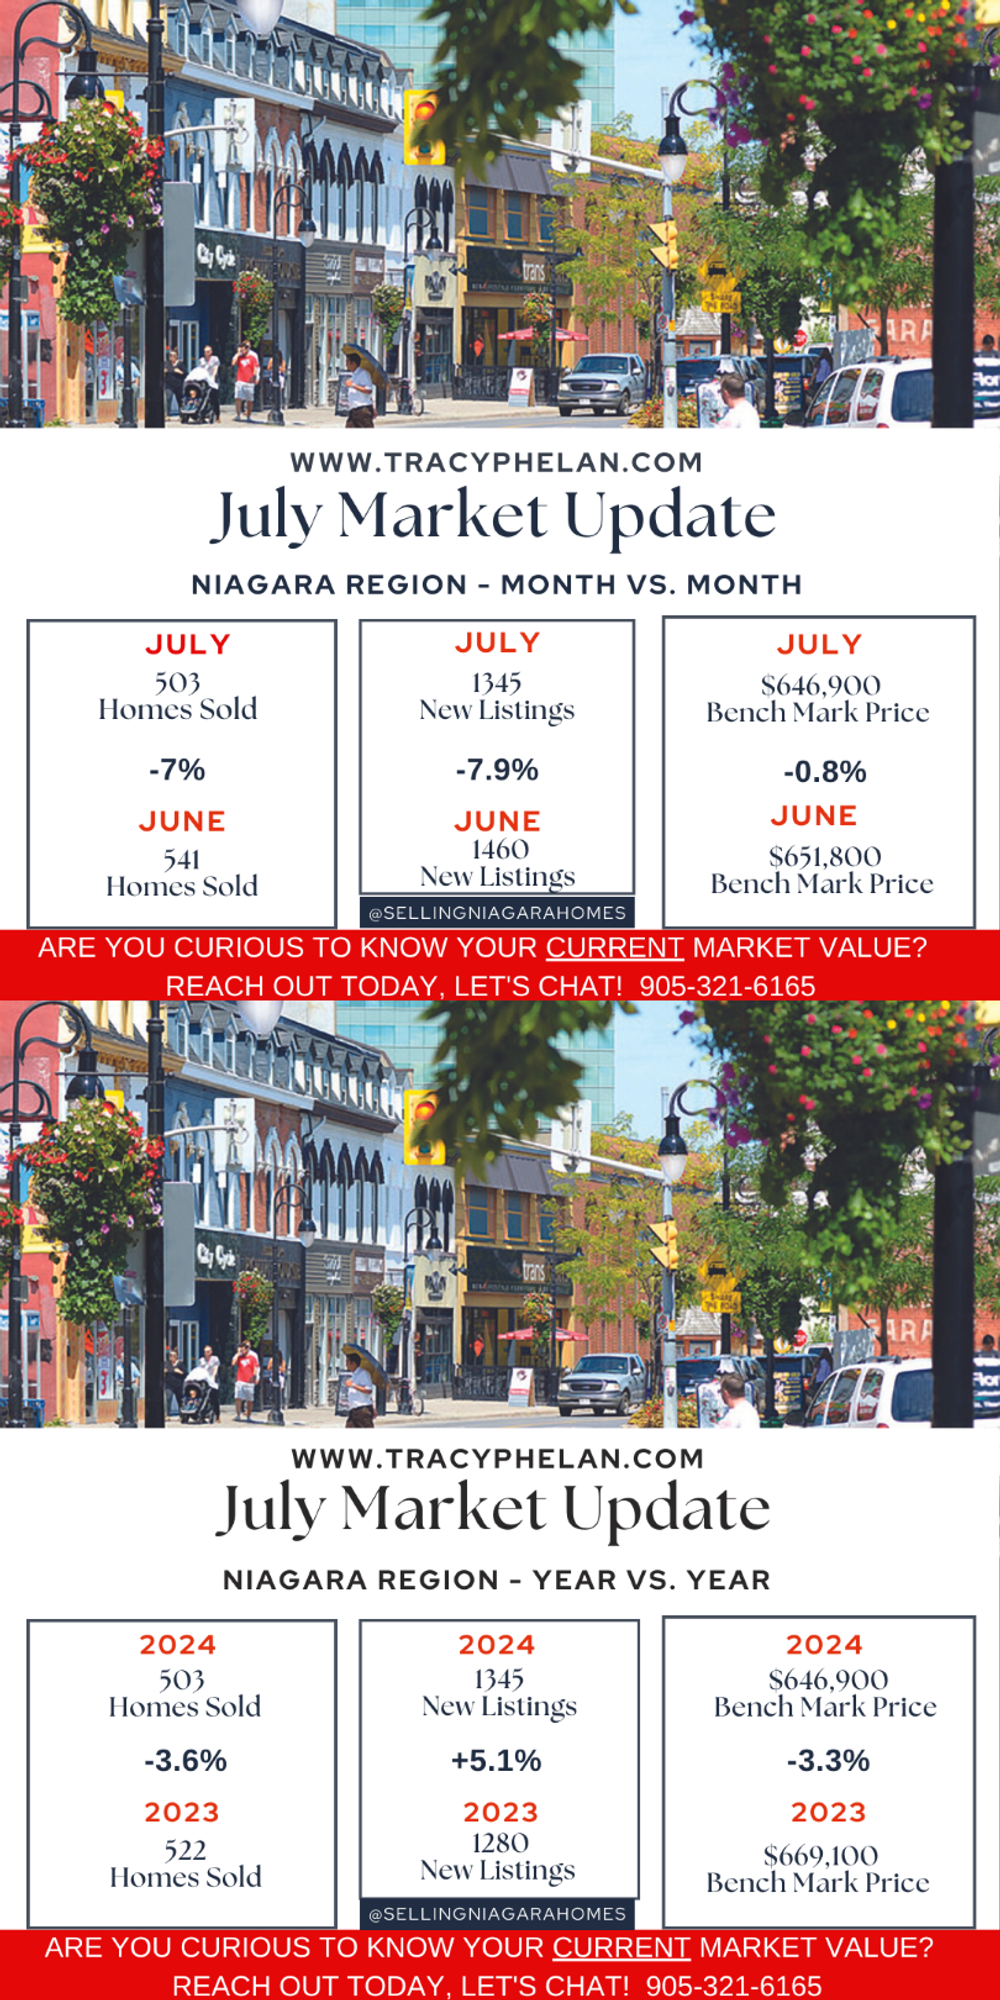
Niagara Real Estate Market Update - August 2024 Residential home sales activity recorded through the MLS® for the Niagara Association of REALTORS® (NAR) totaled 503 units in July 2024, compared to 522 July 2023. In July, the NAR listed 1345 residential properties compared to 1280 in July 2023. The average days it took to sell a home in July 2024 was 42 days, a 31.3% increase from July 2023. The MLS® Home Price Index (HPI), tracks price trends far more accurately than is possible using average or median price measures. The overall MLS® HPI composite benchmark price for the Niagara Region was…
-
Niagara Market Stats - July 2024

CLICK HERE TO READ THE FULL ARTICLE »
-
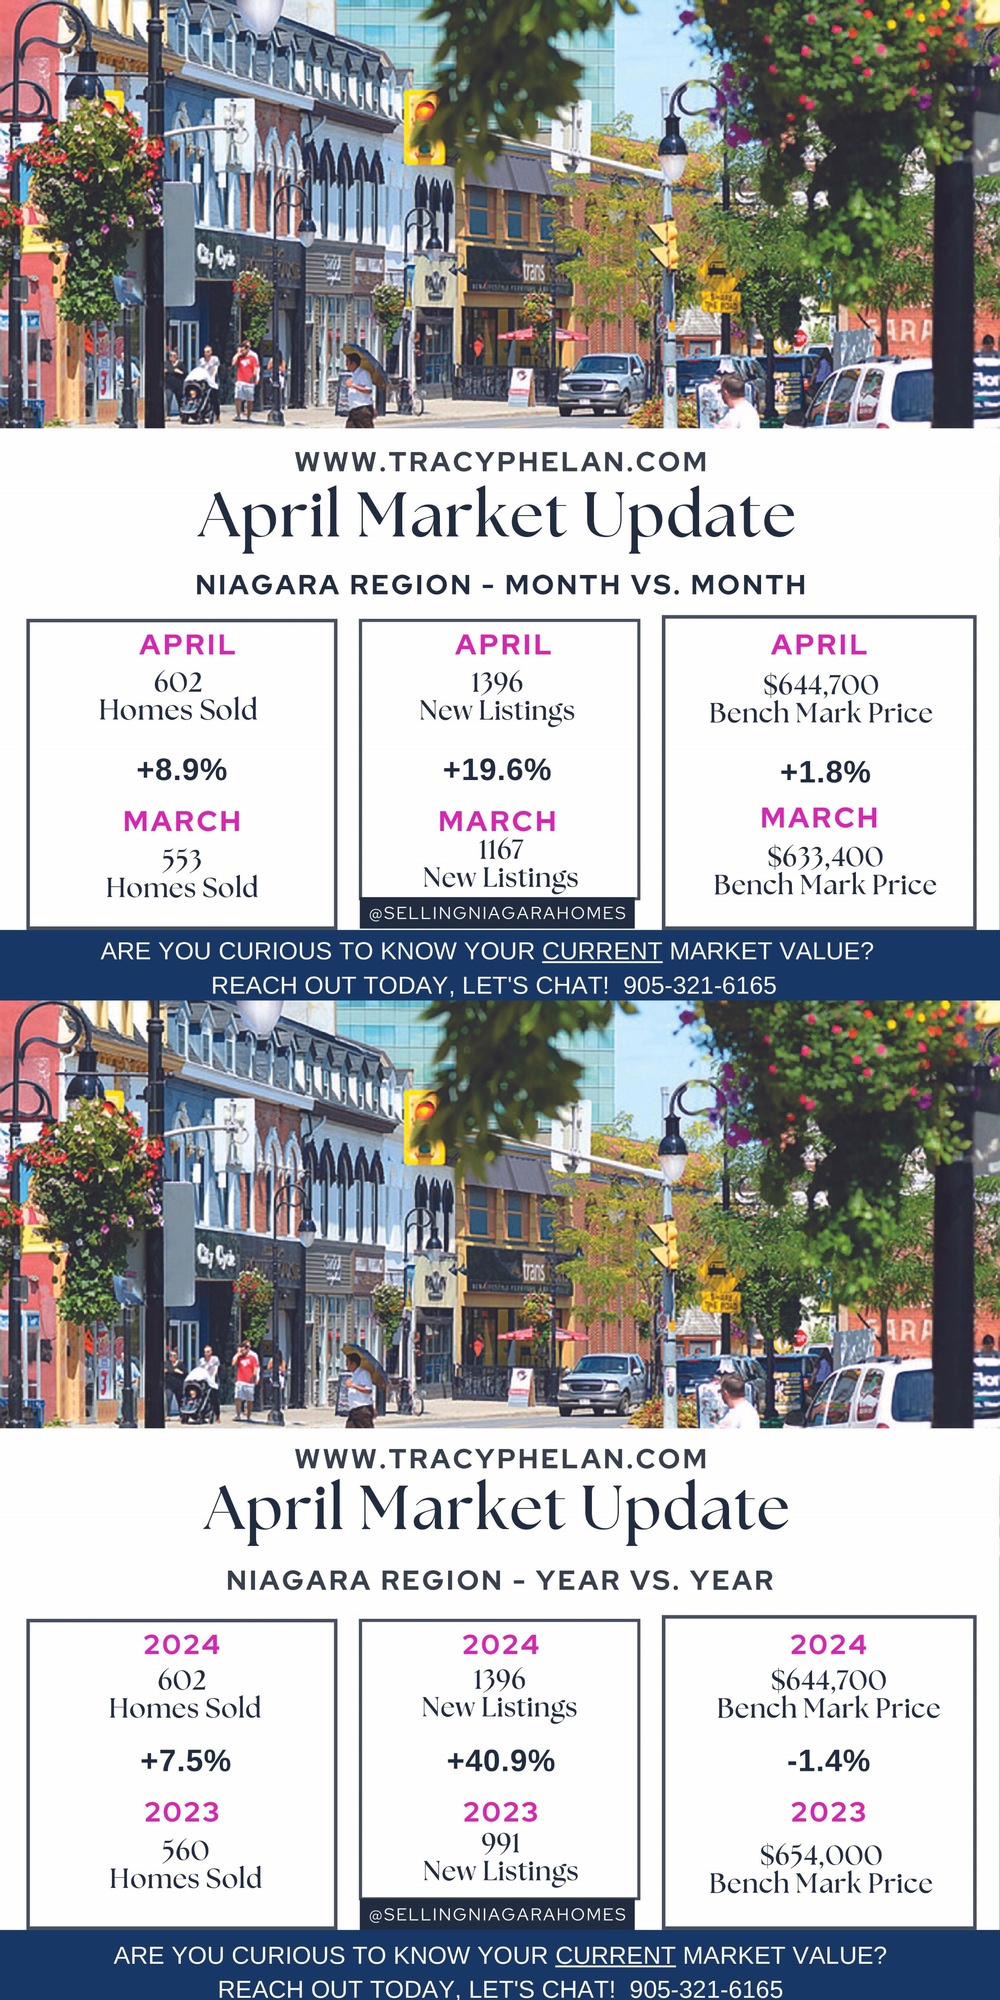
Niagara Market Stats - April 2024

The Niagara Real Estate Market Report Year over Year April 2024 New listings in the Niagara Region were 1396 in April 2024 vs 991 in April 2023, which is a increase of 40.9% Residential home sales in Niagara totaled 602 homes in April 2024 compared to 560 in April 2023, which is a increase of 7.5% The average HPI composite benchmark* price was $644,700 in April 2024, compared to $654000 in April 2023, which is a decrease of 1.4% The Niagara Real Estate Market Report Month to Month, April 2024 vs March 2024. New listings in the…
CLICK HERE TO READ THE FULL ARTICLE »
-
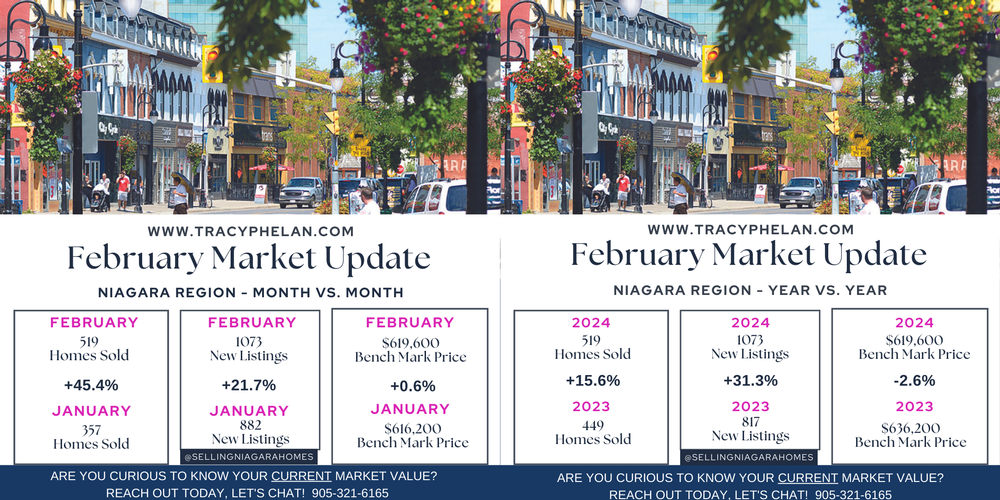
February Real Estate Market Update

The Niagara Real Estate Market Report for February 2024 Spring is on its way!! Everything is heading in the right direction. Compared to January 2024, the number of New Listings (1,073), the number of Sales (519) and the HPI Benchmark price ($619,600) have all increased. Over the last month the number of days on market has decreased - all signs of the market activity trending upwards, reports Niagara Association of REALTORS® The MLS® Home Price Index (HPI), tracks price trends far more accurately than is possible using average or median price measures. The overall MLS® HPI composite benchmark price for the Niagara Region was…
CLICK HERE TO READ THE FULL ARTICLE »


